遥遥领先.NET 7, .NET 8 性能大幅提升

  • 遥遥领先.NET 7, .NET 8 性能大幅提升已关闭评论
  • 126 次浏览
  • A+
所属分类:.NET技术
摘要

每个版本必有的性能提升汇总文章又来了。大家可以学习阅读了。 微软 .NET 开发团队的工程师 Stephen Toub 发表博客《Performance Improvements in .NET 8 》 ,详细介绍了 .NET 8 中的性能改进。

每个版本必有的性能提升汇总文章又来了。大家可以学习阅读了。


微软 .NET 开发团队的工程师 Stephen Toub 发表博Performance Improvements in .NET 8详细介绍了 .NET 8 中的性能改进。

遥遥领先.NET 7, .NET 8 性能大幅提升


一言蔽之:

.NET 7 was super fast. .NET 8 is faster.

.NET 8 比 .NET 7 的超级快更快!

这篇博客全方位介绍了 .NET 8 的性能表现,包括 JIT、原生 AOT、VM、GC、Mono、线程、文件 I/O、网络、JSON 处理、日志等。


Benchmarking Setup

基准设置

在本文中,将使用微基准来突出讨论的改进方面。这些微基准大多使用BenchmarkDotNet v0.13.8实现,除非另有说明,否则每个基准都有一个简单的设置。

要跟随进行,首先确保您已安装.NET 7和.NET 8。在本文中,我使用的是.NET 8 Release Candidate(8.0.0-rc.1.23419.4)。

完成这些先决条件后,在一个新的基准目录中创建一个新的C#项目:

dotnet new console -o benchmarks cd benchmarks

该目录将包含两个文件:benchmarks.csproj(包含有关应该如何构建应用程序的信息的项目文件)和Program.cs(应用程序的代码)。将benchmarks.csproj的全部内容替换为以下内容:

Exe net8.0;net7.0 Preview enable true true

上述项目文件告诉构建系统我们想要:

构建一个可运行的应用程序(而不是库), 能够在.NET 8和.NET 7上运行(以便BenchmarkDotNet可以运行多个进程,一个使用.NET 7,一个使用.NET 8,以便能够比较结果), 尽管C# 12尚未正式发布,但能够使用C#语言的所有最新功能, 自动导入常用命名空间, 在代码中能够使用unsafe关键字, 并将垃圾回收器(GC)配置为“服务器”配置,这影响它在内存消耗和吞吐量之间做出的权衡(这不是严格必需的,我只是习惯使用它,并且对于ASP.NET应用程序来说,这是默认配置)。

最后的从NuGet中引入BenchmarkDotNet,以便我们能够在Program.cs中使用该库。(一些基准需要添加其他包;我已经在适用的位置做了说明。)

然后,我将每个基准的完整Program.cs源代码包含在了里面;只需将该代码复制并粘贴到Program.cs中,替换其全部内容。在每个测试中,您会注意到几个属性可以应用于Tests类。[内存诊断器]属性表示我想跟踪托管分配,[反汇编诊断器]属性表示我想报告实际为测试生成的汇编代码(默认情况下还有一个层级的函数调用),[隐藏列]属性仅仅抑制了BenchmarkDotNet可能默认输出但对我们在这里的目的无关紧要的一些数据列。

然后,运行基准非常简单。每个显示的测试还包括一个以dotnet命令开头的注释,用于运行基准测试。通常是这样的:

dotnet run -c Release -f net7.0 --filter "*" --runtimes net7.0 net8.0

上述dotnet run命令:

以发布版本构建基准。这对性能测试很重要,因为大多数优化在调试构建中都被禁用了,包括C#编译器和JIT编译器。 针对主机项目选择的是.NET 7。通常情况下,对于BenchmarkDotNet,您需要针对您将执行的所有运行时的最低公共标准进行目标设定,以确保所有被使用的API在需要的地方都可用。 运行整个程序中的所有基准。--filter参数可以缩小范围,仅对所需基准的子集进行范围限制,但“*”表示“运行所有基准”。 在.NET 7和.NET 8上运行测试。

整篇文章中,我展示了许多基准和我运行它们时得到的结果。所有的代码在所有支持的操作系统和架构上都运行良好。除非另有说明,否则所示的基准结果均来自在Linux(Ubuntu 22.04)上(一个x64处理器)运行时的结果(唯一的例外是当我使用[反汇编诊断器]显示汇编代码时,我在Windows 11上运行了它们,因为在Unix上使用[反汇编诊断器]运行.NET 7并不总是产生所请求的汇编)。我的标准警告:这些是微基准,通常测量非常短的操作时间,并且当这些时间的改进通过一遍又一遍的执行而累积起来时,其影响是显著的。不同的硬件、不同的操作系统、您的计算机上运行的其他内容、您当前的心情以及您早餐吃了什么都可能影响涉及的数字。简而言之,不要指望您看到的数字与我在这里报告的数字完全匹配,尽管我选择的示例中,所引用的差异的数量级可完全重现。

解释完了,我们开始吧...”


全文请看:   Performance Improvements in .NET 8 - .NET Blog (microsoft.com)


JIT

Code generation permeates every single line of code we write, and it’s critical to the end-to-end performance of applications that the compiler doing that code generation achieves high code quality. In .NET, that’s the job of the Just-In-Time (JIT) compiler, which is used both “just in time” as an application executes as well as in Ahead-Of-Time (AOT) scenarios as the workhorse to perform the codegen at build-time. Every release of .NET has seen significant improvements in the JIT, and .NET 8 is no exception. In fact, I dare say the improvements in .NET 8 in the JIT are an incredible leap beyond what was achieved in the past, in large part due to dynamic PGO…

Tiering and Dynamic PGO

To understand dynamic PGO, we first need to understand “tiering.” For many years, a .NET method was only ever compiled once: on first invocation of the method, the JIT would kick in to generate code for that method, and then that invocation and every subsequent one would use that generated code. It was a simple time, but also one frought with conflict… in particular, a conflict between how much the JIT should invest in code quality for the method and how much benefit would be gained from that enhanced code quality. Optimization is one of the most expensive things a compiler does; a compiler can spend an untold amount of time searching for additional ways to shave off an instruction here or improve the instruction sequence there. But none of us has an infinite amount of time to wait for the compiler to finish, especially in a “just in time” scenario where the compilation is happening as the application is running. As such, in a world where a method is compiled once for that process, the JIT has to either pessimize code quality or pessimize how long it takes to run, which means a tradeoff between steady-state throughput and startup time.

As it turns out, however, the vast majority of methods invoked in an application are only ever invoked once or a small number of times. Spending a lot of time optimizing such methods would actually be a deoptimization, as likely it would take much more time to optimize them than those optimizations would gain. So, .NET Core 3.0 introduced a new feature of the JIT known as “tiered compilation.” With tiering, a method could end up being compiled multiple times. On first invocation, the method would be compiled in “tier 0,” in which the JIT prioritizes speed of compilation over code quality; in fact, the mode the JIT uses is often referred to as “min opts,” or minimal optimization, because it does as little optimization as it can muster (it still maintains a few optimizations, primarily the ones that result in less code to be compiled such that the JIT actually runs faster). In addition to minimizing optimizations, however, it also employs call counting “stubs”; when you invoke the method, the call goes through a little piece of code (the stub) that counts how many times the method was invoked, and once that count crosses a predetermined threshold (e.g. 30 calls), the method gets queued for re-compilation, this time at “tier 1,” in which the JIT throws every optimization it’s capable of at the method. Only a small subset of methods make it to tier 1, and those that do are the ones worthy of additional investment in code quality. Interestingly, there are things the JIT can learn about the method from tier 0 that can lead to even better tier 1 code quality than if the method had been compiled to tier 1 directly. For example, the JIT knows that a method “tiering up” from tier 0 to tier 1 has already been executed, and if it’s already been executed, then any static readonly fields it accesses are now already initialized, which means the JIT can look at the values of those fields and base the tier 1 code gen on what’s actually in the field (e.g. if it’s a static readonly bool, the JIT can now treat the value of that field as if it were const bool). If the method were instead compiled directly to tier 1, the JIT might not be able to make the same optimizations. Thus, with tiering, we can “have our cake and eat it, too.” We get both good startup and good throughput. Mostly…

One wrinkle to this scheme, however, is the presence of longer-running methods. Methods might be important because they’re invoked many times, but they might also be important because they’re invoked only a few times but end up running forever, in particular due to looping. As such, tiering was disabled by default for methods containing backward branches, such that those methods would go straight to tier 1. To address that, .NET 7 introduced On-Stack Replacement (OSR). With OSR, the code generated for loops also included a counting mechanism, and after a loop iterated to a certain threshold, the JIT would compile a new optimized version of the method and jump from the minimally-optimized code to continue execution in the optimized variant. Pretty slick, and with that, in .NET 7 tiering was also enabled for methods with loops.

But why is OSR important? If there are only a few such long-running methods, what’s the big deal if they just go straight to tier 1? Surely startup isn’t significantly negatively impacted? First, it can be: if you’re trying to trim milliseconds off startup time, every method counts. But second, as noted before, there are throughput benefits to going through tier 0, in that there are things the JIT can learn about a method from tier 0 which can then improve its tier 1 compilation. And the list of things the JIT can learn gets a whole lot bigger with dynamic PGO.

Profile-Guided Optimization (PGO) has been around for decades, for many languages and environments, including in .NET world. The typical flow is you build your application with some additional instrumentation, you then run your application on key scenarios, you gather up the results of that instrumentation, and then you rebuild your application, feeding that instrumentation data into the optimizer, allowing it to use the knowledge about how the code executed to impact how it’s optimized. This approach is often referred to as “static PGO.” “Dynamic PGO” is similar, except there’s no effort required around how the application is built, scenarios it’s run on, or any of that. With tiering, the JIT is already generating a tier 0 version of the code and then a tier 1 version of the code… why not sprinkle some instrumentation into the tier 0 code as well? Then the JIT can use the results of that instrumentation to better optimize tier 1. It’s the same basic “build, run and collect, re-build” flow as with static PGO, but now on a per-method basis, entirely within the execution of the application, and handled automatically for you by the JIT, with zero additional dev effort required and zero additional investment needed in build automation or infrastructure.

Dynamic PGO first previewed in .NET 6, off by default. It was improved in .NET 7, but remained off by default. Now, in .NET 8, I’m thrilled to say it’s not only been significantly improved, it’s now on by default. This one-character PR to enable it might be the most valuable PR in all of .NET 8: dotnet/runtime#86225.

There have been a multitude of PRs to make all of this work better in .NET 8, both on tiering in general and then on dynamic PGO in particular. One of the more interesting changes is dotnet/runtime#70941, which added more tiers, though we still refer to the unoptimized as “tier 0” and the optimized as “tier 1.” This was done primarily for two reasons. First, instrumentation isn’t free; if the goal of tier 0 is to make compilation as cheap as possible, then we want to avoid adding yet more code to be compiled. So, the PR adds a new tier to address that. Most code first gets compiled to an unoptimized and uninstrumented tier (though methods with loops currently skip this tier). Then after a certain number of invocations, it gets recompiled unoptimized but instrumented. And then after a certain number of invocations, it gets compiled as optimized using the resulting instrumentation data. Second, crossgen/ReadyToRun (R2R) images were previously unable to participate in dynamic PGO. This was a big problem for taking full advantage of all that dynamic PGO offers, in particular because there’s a significant amount of code that every .NET application uses that’s already R2R’d: the core libraries. ReadyToRun is an AOT technology that enables most of the code generation work to be done at build-time, with just some minimal fix-ups applied when that precompiled code is prepared for execution. That code is optimized and not instrumented, or else the instrumentation would slow it down. So, this PR also adds a new tier for R2R. After an R2R method has been invoked some number of times, it’s recompiled, again with optimizations but this time also with instrumentation, and then when that’s been invoked sufficiently, it’s promoted again, this time to an optimized implementation utilizing the instrumentation data gathered in the previous tier. 遥遥领先.NET 7, .NET 8 性能大幅提升
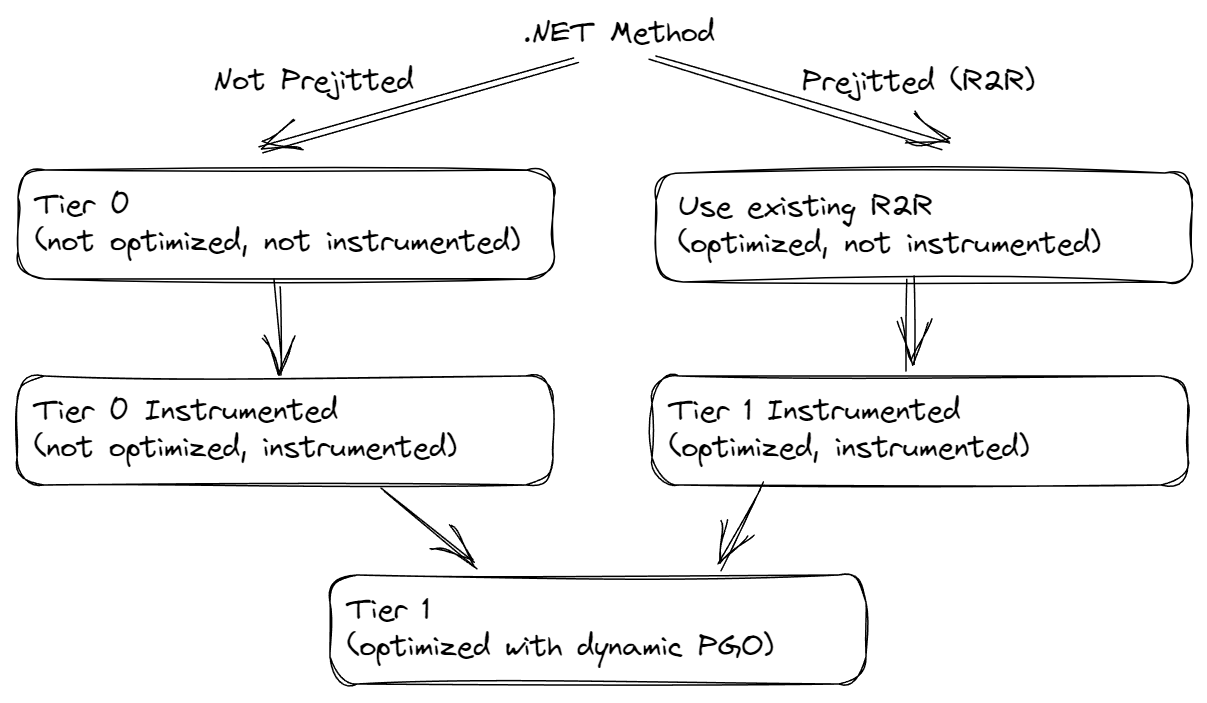
There have also been multiple changes focused on doing more optimization in tier 0. As noted previously, the JIT wants to be able to compile tier 0 as quickly as possible, however some optimizations in code quality actually help it to do that. For example, dotnet/runtime#82412 teaches it to do some amount of constant folding (evaluating constant expressions at compile time rather than at execution time), as that can enable it to generate much less code. Much of the time the JIT spends compiling in tier 0 is for interactions with the Virtual Machine (VM) layer of the .NET runtime, such as resolving types, and so if it can significantly trim away branches that won’t ever be used, it can actually speed up tier 0 compilation while also getting better code quality. We can see this with a simple repro app like the following:

// dotnet run -c Release -f net8.0  MaybePrint(42.0);  static void MaybePrint<T>(T value) {     if (value is int)         Console.WriteLine(value); }

I can set the DOTNET_JitDisasm environment variable to *MaybePrint*; that will result in the JIT printing out to the console the code it emits for this method. On .NET 7, when I run this (dotnet run -Release -f net7.0), I get the following tier 0 code:

; Assembly listing for method Program:<<Main>$>g__MaybePrint|0_0[double](double) ; Emitting BLENDED_CODE for X64 CPU with AVX - Windows ; Tier-0 compilation ; MinOpts code ; rbp based frame ; partially interruptible  G_M000_IG01:                ;; offset=0000H        55                   push     rbp        4883EC30             sub      rsp, 48        C5F877               vzeroupper        488D6C2430           lea      rbp, [rsp+30H]        33C0                 xor      eax, eax        488945F8             mov      qword ptr [rbp-08H], rax        C5FB114510           vmovsd   qword ptr [rbp+10H], xmm0  G_M000_IG02:                ;; offset=0018H        33C9                 xor      ecx, ecx        85C9                 test     ecx, ecx        742D                 je       SHORT G_M000_IG03        48B9B877CB99F97F0000 mov      rcx, 0x7FF999CB77B8        E813C9AE5F           call     CORINFO_HELP_NEWSFAST        488945F8             mov      gword ptr [rbp-08H], rax        488B4DF8             mov      rcx, gword ptr [rbp-08H]        C5FB104510           vmovsd   xmm0, qword ptr [rbp+10H]        C5FB114108           vmovsd   qword ptr [rcx+08H], xmm0        488B4DF8             mov      rcx, gword ptr [rbp-08H]        FF15BFF72000         call     [System.Console:WriteLine(System.Object)]  G_M000_IG03:                ;; offset=0049H        90                   nop  G_M000_IG04:                ;; offset=004AH        4883C430             add      rsp, 48        5D                   pop      rbp        C3                   ret  ; Total bytes of code 80

The important thing to note here is that all of the code associated with the Console.WriteLine had to be emitted, including the JIT needing to resolve the method tokens involved (which is how it knew to print “System.Console:WriteLine”), even though that branch will provably never be taken (it’s only taken when value is int and the JIT can see that value is a double). Now in .NET 8, it applies the previously-reserved-for-tier-1 constant folding optimizations that recognize the value is not an int and generates tier 0 code accordingly (dotnet run -Release -f net8.0):

; Assembly listing for method Program:<<Main>$>g__MaybePrint|0_0[double](double) (Tier0) ; Emitting BLENDED_CODE for X64 with AVX - Windows ; Tier0 code ; rbp based frame ; partially interruptible  G_M000_IG01:                ;; offset=0x0000        push     rbp        mov      rbp, rsp        vmovsd   qword ptr [rbp+0x10], xmm0  G_M000_IG02:                ;; offset=0x0009  G_M000_IG03:                ;; offset=0x0009        pop      rbp        ret  ; Total bytes of code 11

dotnet/runtime#77357 and dotnet/runtime#83002 also enable some JIT intrinsics to be employed in tier 0 (a JIT intrinsic is a method the JIT has some special knowledge of, either knowing about its behavior so it can optimize around it accordingly, or in many cases actually supplying its own implementation to replace the one in the method’s body). This is in part for the same reason; many intrinsics can result in better dead code elimination (e.g. if (typeof(T).IsValueType) { ... }). But more so, without recognizing intrinsics as being special, we might end up generating code for an intrinsic method that we would never otherwise need to generate code for, even in tier 1. dotnet/runtime#88989 also eliminates some forms of boxing in tier 0.

Collecting all of this instrumentation in tier 0 instrumented code brings with it some of its own challenges. The JIT is augmenting a bunch of methods to track a lot of additional data; where and how does it track it? And how does it do so safely and correctly when multiple threads are potentially accessing all of this at the same time? For example, one of the things the JIT tracks in an instrumented method is which branches are followed and how frequently; that requires it to count each time code traverses that branch. You can imagine that happens, well, a lot. How can it do the counting in a thread-safe yet efficient way?

The answer previously was, it didn’t. It used racy, non-synchronized updates to a shared value, e.g. _branches[branchNum]++. This means that some updates might get lost in the presence of multithreaded access, but as the answer here only needs to be approximate, that was deemed ok. As it turns out, however, in some cases it was resulting in a lot of lost counts, which in turn caused the JIT to optimize for the wrong things. Another approach tried for comparison purposes in dotnet/runtime#82775 was to use interlocked operations (e.g. if this were C#, Interlocked.Increment); that results in perfect accuracy, but that explicit synchronization represents a huge potential bottleneck when heavily contended. dotnet/runtime#84427 provides the approach that’s now enabled by default in .NET 8. It’s an implementation of a scalable approximate counter that employs some amount of pseudo-randomness to decide how often to synchronize and by how much to increment the shared count. There’s a great description of all of this in the dotnet/runtime repo; here is a C# implementation of the counting logic based on that discussion:

static void Count(ref uint sharedCounter) {     uint currentCount = sharedCounter, delta = 1;     if (currentCount > 0)     {         int logCount = 31 - (int)uint.LeadingZeroCount(currentCount);         if (logCount >= 13)         {             delta = 1u << (logCount - 12);             uint random = (uint)Random.Shared.NextInt64(0, uint.MaxValue + 1L);             if ((random & (delta - 1)) != 0)             {                 return;             }         }     }      Interlocked.Add(ref sharedCounter, delta); }

For current count values less than 8192, it ends up just doing the equivalent of an Interlocked.Add(ref counter, 1). However, as the count increases to beyond that threshold, it starts only doing the add randomly half the time, and when it does, it adds 2. Then randomly a quarter of the time it adds 4. Then an eighth of the time it adds 8. And so on. In this way, as more and more increments are performed, it requires writing to the shared counter less and less frequently.

We can test this out with a little app like the following (if you want to try running it, just copy the above Count into the program as well):

// dotnet run -c Release -f net8.0  using System.Diagnostics;  uint counter = 0; const int ItersPerThread = 100_000_000;  while (true) {     Run("Interlock", _ => { for (int i = 0; i < ItersPerThread; i++) Interlocked.Increment(ref counter); });     Run("Racy     ", _ => { for (int i = 0; i < ItersPerThread; i++) counter++; });     Run("Scalable ", _ => { for (int i = 0; i < ItersPerThread; i++) Count(ref counter); });     Console.WriteLine(); }  void Run(string name, Action<int> body) {     counter = 0;     long start = Stopwatch.GetTimestamp();     Parallel.For(0, Environment.ProcessorCount, body);     long end = Stopwatch.GetTimestamp();     Console.WriteLine($"{name} => Expected: {Environment.ProcessorCount * ItersPerThread:N0}, Actual: {counter,13:N0}, Elapsed: {Stopwatch.GetElapsedTime(start, end).TotalMilliseconds}ms"); }

When I run that, I get results like this:

Interlock => Expected: 1,200,000,000, Actual: 1,200,000,000, Elapsed: 20185.548ms Racy      => Expected: 1,200,000,000, Actual:   138,526,798, Elapsed: 987.4997ms Scalable  => Expected: 1,200,000,000, Actual: 1,193,541,836, Elapsed: 1082.8471ms

I find these results fascinating. The interlocked approach gets the exact right count, but it’s super slow, ~20x slower than the other approaches. The fastest is the racy additions one, but its count is also wildly inaccurate: it was off by a factor of 8x! The scalable counters solution was only a hair slower than the racy solution, but its count was only off the expected value by 0.5%. This scalable approach then enables the JIT to track what it needs with the efficiency and approximate accuracy it needs. Other PRs like dotnet/runtime#82014dotnet/runtime#81731, and dotnet/runtime#81932 also went into improving the JIT’s efficiency around tracking this information.

As it turns out, this isn’t the only use of randomness in dynamic PGO. Another is used as part of determining which types are the most common targets of virtual and interface method calls. At a given call site, the JIT wants to know which type is most commonly used and by what percentage; if there’s a clear winner, it can then generate a fast path specific to that type. As in the previous example, tracking a count for every possible type that might come through is expensive. Instead, it uses an algorithm known as “reservoir sampling”. Let’s say I have a char[1_000_000] containing ~60% 'a's, ~30% 'b's, and ~10% 'c's, and I want to know which is the most common. With reservoir sampling, I might do so like this:

// dotnet run -c Release -f net8.0  // Create random input for testing, with 60% a, 30% b, 10% c char[] chars = new char[1_000_000]; Array.Fill(chars, 'a', 0, 600_000); Array.Fill(chars, 'b', 600_000, 300_000); Array.Fill(chars, 'c', 900_000, 100_000); Random.Shared.Shuffle(chars);  for (int trial = 0; trial < 5; trial++) {     // Reservoir sampling     char[] reservoir = new char[32]; // same reservoir size as the JIT     int next = 0;     for (int i = 0; i < reservoir.Length && next < chars.Length; i++, next++)     {         reservoir[i] = chars[i];     }     for (; next < chars.Length; next++)     {         int r = Random.Shared.Next(next + 1);         if (r < reservoir.Length)         {             reservoir[r] = chars[next];         }     }      // Print resulting percentages     Console.WriteLine($"a: {reservoir.Count(c => c == 'a') * 100.0 / reservoir.Length}");     Console.WriteLine($"b: {reservoir.Count(c => c == 'b') * 100.0 / reservoir.Length}");     Console.WriteLine($"c: {reservoir.Count(c => c == 'c') * 100.0 / reservoir.Length}");     Console.WriteLine();}

When I run this, I get results like the following:

a: 53.125 b: 31.25 c: 15.625  a: 65.625 b: 28.125 c: 6.25  a: 68.75 b: 25 c: 6.25  a: 40.625 b: 31.25 c: 28.125  a: 59.375 b: 25 c: 15.625

Note that in the above example, I actually had all the data in advance; in contrast, the JIT likely has multiple threads all running instrumented code and overwriting elements in the reservoir. I also happened to choose the same size reservoir the JIT is using as of dotnet/runtime#87332, which highlights how that value was chosen for its use case and why it needed to be tweaked.

On all five runs above, it correctly found there to be more 'a's than 'b's and more 'b's than 'c's, and it was often reasonably close to the actual percentages. But, importantly, randomness is involved here, and every run produced slightly different results. I mention this because that means the JIT compiler now incorporates randomness, which means that the produced dynamic PGO instrumentation data is very likely to be slightly different from run to run. However, even without explicit use of randomness, there’s already non-determinism in such code, and in general there’s enough data produced that the overall behavior is quite stable and repeatable.

Interestingly, the JIT’s PGO-based optimizations aren’t just based on the data gathered during instrumented tier 0 execution. With dotnet/runtime#82926 (and a handful of follow-on PRs like dotnet/runtime#83068dotnet/runtime#83567dotnet/runtime#84312, and dotnet/runtime#84741), the JIT will now create a synthetic profile based on statically analyzing the code and estimating a profile, such as with various approaches to static branch prediction. The JIT can then blend this data together with the instrumentation data, helping to fill in data where there are gaps (think “Jurassic Park” and using modern reptile DNA to plug the gaps in the recovered dinosaur DNA).

Beyond the mechanisms used to enable tiering and dynamic PGO getting better (and, did I mention, being on by default?!) in .NET 8, the optimizations it performs also get better. One of the main optimizations dynamic PGO feeds is the ability to devirtualize virtual and interface calls per call site. As noted, the JIT tracks what concrete types are used, and then can generate a fast path for the most common type; this is known as guarded devirtualization (GDV). Consider this benchmark:

// dotnet run -c Release -f net7.0 --filter "*" --runtimes net7.0 net8.0  using BenchmarkDotNet.Attributes; using BenchmarkDotNet.Running;  BenchmarkSwitcher.FromAssembly(typeof(Tests).Assembly).Run(args);  [HideColumns("Error", "StdDev", "Median", "RatioSD")] [DisassemblyDiagnoser(maxDepth: 0)] public class Tests {     internal interface IValueProducer     {         int GetValue();     }      class Producer42 : IValueProducer     {         public int GetValue() => 42;     }      private IValueProducer _valueProducer;     private int _factor = 2;      [GlobalSetup]     public void Setup() => _valueProducer = new Producer42();      [Benchmark]     public int GetValue() => _valueProducer.GetValue() * _factor; }

The GetValue method is doing:

return _valueProducer.GetValue() * _factor;

Without PGO, that’s just a normal interface dispatch. With PGO, however, the JIT will end up seeing that the actual type of _valueProducer is most commonly Producer42, and it will end up generating tier 1 code closer to if my benchmark was instead:

int result = _valueProducer.GetType() == typeof(Producer42) ?     Unsafe.As<Producer42>(_valueProducer).GetValue() :     _valueProducer.GetValue(); return result * _factor;

It can then in turn see that the Producer42.GetValue() method is really simple, and so not only is the GetValue call devirtualized, it’s also inlined, such that the code effectively becomes:

int result = _valueProducer.GetType() == typeof(Producer42) ?     42 :     _valueProducer.GetValue(); return result * _factor;

We can confirm this by running the above benchmark. The resulting numbers certainly show something going on:

Method Runtime Mean Ratio Code Size
GetValue .NET 7.0 1.6430 ns 1.00 35 B
GetValue .NET 8.0 0.0523 ns 0.03 57 B

We see it’s both faster (which we expected) and more code (which we also expected). Now for the assembly. On .NET 7, we get this:

; Tests.GetValue()        push      rsi        sub       rsp,20        mov       rsi,rcx        mov       rcx,[rsi+8]        mov       r11,7FF999B30498        call      qword ptr [r11]        imul      eax,[rsi+10]        add       rsp,20        pop       rsi        ret ; Total bytes of code 35

We can see it’s performing the interface call (the three movs followed by the call) and then multiplying the result by _factor (imul eax,[rsi+10]). Now on .NET 8, we get this:

; Tests.GetValue()        push      rbx        sub       rsp,20        mov       rbx,rcx        mov       rcx,[rbx+8]        mov       rax,offset MT_Tests+Producer42        cmp       [rcx],rax        jne       short M00_L01        mov       eax,2A M00_L00:        imul      eax,[rbx+10]        add       rsp,20        pop       rbx        ret M00_L01:        mov       r11,7FFA1FAB04D8        call      qword ptr [r11]        jmp       short M00_L00 ; Total bytes of code 57

We still see the call, but it’s buried in a cold section at the end. Instead, we see the type of the object being compared against MT_Tests+Producer42, and if it matches (the cmp [rcx],rax followed by the jne), we store 2A into eax2A is the hex representation of 42, so this is the entirety of the inlined body of the devirtualized Producer42.GetValue call. .NET 8 is also capable of doing multiple GDVs, meaning it can generate fast paths for more than 1 type, thanks in large part to dotnet/runtime#86551 and dotnet/runtime#86809. However, this is off by default and for now needs to be opted-into with a configuration setting (setting the DOTNET_JitGuardedDevirtualizationMaxTypeChecks environment variable to the desired maximum number of types for which to test). We can see the impact of that with this benchmark (note that because I’ve explicitly specified the configs to use in the code itself, I’ve omitted the --runtimes argument in the dotnet command):

// dotnet run -c Release -f net8.0 --filter "*"  using BenchmarkDotNet.Attributes; using BenchmarkDotNet.Configs; using BenchmarkDotNet.Environments; using BenchmarkDotNet.Jobs; using BenchmarkDotNet.Running; using System.Runtime.CompilerServices;  var config = DefaultConfig.Instance     .AddJob(Job.Default.WithId("ChecksOne").WithRuntime(CoreRuntime.Core80))     .AddJob(Job.Default.WithId("ChecksThree").WithRuntime(CoreRuntime.Core80).WithEnvironmentVariable("DOTNET_JitGuardedDevirtualizationMaxTypeChecks", "3")); BenchmarkSwitcher.FromAssembly(typeof(Tests).Assembly).Run(args, config);  [HideColumns("Error", "StdDev", "Median", "RatioSD", "EnvironmentVariables")] [DisassemblyDiagnoser] public class Tests {     private readonly A _a = new();     private readonly B _b = new();     private readonly C _c = new();      [Benchmark]     public void Multiple()     {         DoWork(_a);         DoWork(_b);         DoWork(_c);     }      [MethodImpl(MethodImplOptions.NoInlining)]     private static int DoWork(IMyInterface i) => i.GetValue();      private interface IMyInterface { int GetValue(); }     private class A : IMyInterface { public intGetValue()=>123;}privateclass B :IMyInterface{publicintGetValue()=>456;}privateclass C :IMyInterface{publicintGetValue()=>789;}}
Method Job Mean Code Size
Multiple ChecksOne 7.463 ns 90 B
Multiple ChecksThree 5.632 ns 133 B

And in the assembly code with the environment variable set, we can indeed see it doing multiple checks for three types before falling back to the general interface dispatch:

; Tests.DoWork(IMyInterface)        sub       rsp,28        mov       rax,offset MT_Tests+A        cmp       [rcx],rax        jne       short M01_L00        mov       eax,7B        jmp       short M01_L02 M01_L00:        mov       rax,offset MT_Tests+B        cmp       [rcx],rax        jne       short M01_L01        mov       eax,1C8        jmp       short M01_L02 M01_L01:        mov       rax,offset MT_Tests+C        cmp       [rcx],rax        jne       short M01_L03        mov       eax,315 M01_L02:        add       rsp,28        ret M01_L03:        mov       r11,7FFA1FAC04D8        call      qword ptr [r11]        jmp       short M01_L02 ; Total bytes of code 88

(Interestingly, this optimization gets a bit better in Native AOT. There, with dotnet/runtime#87055, there can be no need for the fallback path. The compiler can see the entire program being optimized and can generate fast paths for all of the types that implement the target abstraction if it’s a small number.)

dotnet/runtime#75140 provides another really nice optimization, still related to GDV, but now for delegates and in relation to loop cloning. Take the following benchmark:

// dotnet run -c Release -f net7.0 --filter "*" --runtimes net7.0 net8.0  using BenchmarkDotNet.Attributes; using BenchmarkDotNet.Running;  BenchmarkSwitcher.FromAssembly(typeof(Tests).Assembly).Run(args);  [HideColumns("Error", "StdDev", "Median", "RatioSD")] [DisassemblyDiagnoser] public class Tests {     private readonly Func<int, int> _func = i => i + 1;      [Benchmark]     public int Sum() => Sum(_func);      private static int Sum(Func<int, int> func)     {         int sum = 0;         for (int i = 0; i < 10_000; i++)         {             sum += func(i);         }          return sum;     } }

Dynamic PGO is capable of doing GDV with delegates just as it is with virtual and interface methods. The JIT’s profiling of this method will highlight that the function being invoked is always the same => i + 1 lambda, and as we saw, that can then be transformed into a method something like the following pseudo-code:

private static int Sum(Func<int, int> func) {     int sum = 0;     for (int i = 0; i < 10_000; i++)     {         sum += func.Method == KnownLambda ? i + 1 : func(i);     }      return sum; }

It’s not very visible that inside our loop we’re performing the same check over and over and over. We’re also branching based on it. One common compiler optimization is “hoisting,” where a computation that’s “loop invariant” (meaning it doesn’t change per iteration) can be pulled out of the loop to be above it, e.g.

private static int Sum(Func<int, int> func) {     int sum = 0;     bool isAdd = func.Method == KnownLambda;     for (int i = 0; i < 10_000; i++)     {         sum += isAdd ? i + 1 : func(i);     }      return sum; }

but even with that, we still have the branch on each iteration. Wouldn’t it be nice if we could hoist that as well? What if we could “clone” the loop, duplicating it once for when the method is the known target and once for when it’s not. That’s “loop cloning,” an optimization the JIT is already capable of for other reasons, and now in .NET 8 the JIT is capable of that with this exact scenario, too. The code it’ll produce ends up then being very similar to this:

private static int Sum(Func<int, int> func) {     int sum = 0;     if (func.Method == KnownLambda)     {         for (int i = 0; i < 10_000; i++)         {             sum += i + 1;         }     }     else     {         for (int i = 0; i < 10_000; i++)         {             sum += func(i);         }     }     return sum; }

Looking at the generated assembly on .NET 8 confirms this:

; Tests.Sum(System.Func`2<Int32,Int32>)        push      rdi        push      rsi        push      rbx        sub       rsp,20        mov       rbx,rcx        xor       esi,esi        xor       edi,edi        test      rbx,rbx        je        short M01_L01        mov       rax,7FFA2D630F78        cmp       [rbx+18],rax        jne       short M01_L01 M01_L00:        inc       edi        mov       eax,edi        add       esi,eax        cmp       edi,2710        jl        short M01_L00        jmp       short M01_L03 M01_L01:        mov       rax,7FFA2D630F78        cmp       [rbx+18],rax        jne       short M01_L04        lea       eax,[rdi+1] M01_L02:        add       esi,eax        inc       edi        cmp       edi,2710        jl        short M01_L01 M01_L03:        mov       eax,esi        add       rsp,20        pop       rbx        pop       rsi        pop       rdi        ret M01_L04:        mov       edx,edi        mov       rcx,[rbx+8]        call      qword ptr [rbx+18]        jmp       short M01_L02 ; Total bytes of code 103

Focus just on the M01_L00 block: you can see it ends with a jl short M01_L00 to loop back around to M01_L00 if edi (which is storing i) is less than 0x2710, or 10,000 decimal, aka our loop’s upper bound. Note that there are just a few instructions in the middle, nothing at all resembling a call… this is the optimized cloned loop, where our lambda has been inlined. There’s another loop that alternates between M01_L02M01_L01, and M01_L04, and that one does have a call… that’s the fallback loop. And if we run the benchmark, we see a huge resulting improvement:

Method Runtime Mean Ratio Code Size
Sum .NET 7.0 16.546 us 1.00 55 B
Sum .NET 8.0 2.320 us 0.14 113 B

As long as we’re discussing hoisting, it’s worth noting other improvements have also contributed. In particular, dotnet/runtime#81635 enables the JIT to hoist more code used in generic method dispatch. We can see that in action with a benchmark like this:

// dotnet run -c Release -f net7.0 --filter "*" --runtimes net7.0 net8.0  using BenchmarkDotNet.Attributes; using BenchmarkDotNet.Running; using System.Runtime.CompilerServices;  BenchmarkSwitcher.FromAssembly(typeof(Tests).Assembly).Run(args);  [HideColumns("Error", "StdDev", "Median", "RatioSD")] public class Tests {     [Benchmark]     public void Test() => Test<string>();      static void Test<T>()     {         for (int i = 0; i < 100; i++)         {             Callee<T>();         }     }      [MethodImpl(MethodImplOptions.NoInlining)]     static void Callee<T>() { } }

全文请看: Performance Improvements in .NET 8 - .NET Blog (microsoft.com)

全文请看:   Performance Improvements in .NET 8 - .NET Blog (microsoft.com)